AI in Research
We use generative AI as a research aid alongside observations and analysis. Human review of its outputs remains central to examining questions and interpretations.

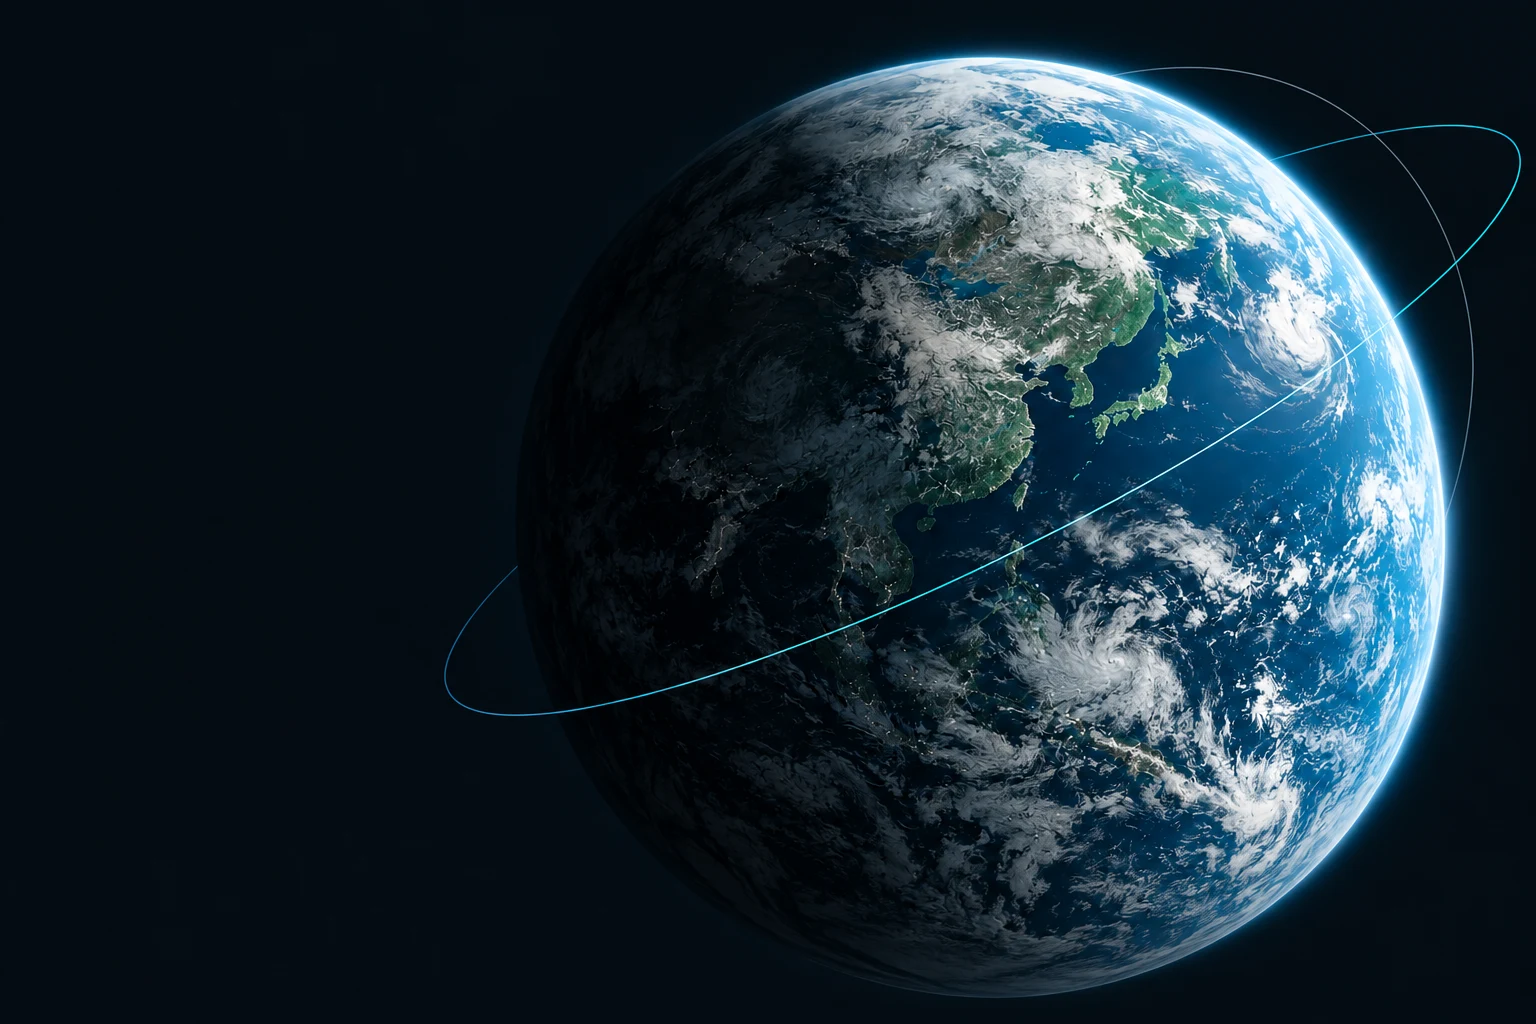
Academic Research Division of F-Factory Co., Ltd.
We study ionospheric and geomagnetic variations using satellite and ground observations.
We use generative AI in our research and support researchers with AI adoption and academic websites.
01 Research Domains
We compare satellite, ground-based magnetic-field, and GNSS data to study variations in the near-Earth environment and the conditions behind them.
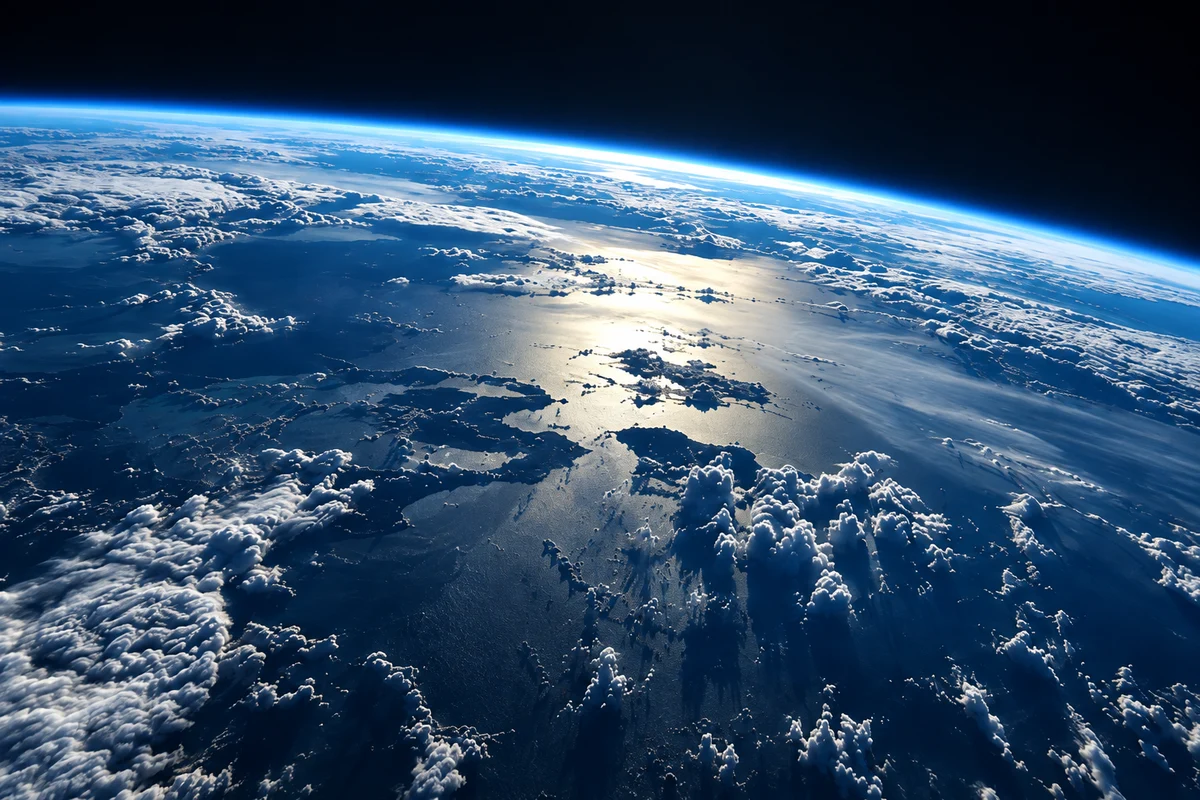
We compare satellite magnetic-field and plasma data with ground observations, accounting for the satellite position and observation time.
We study short-period magnetic-field variations such as Pc3 by examining their periods, polarization, and background space conditions.
We use GNSS-TEC and satellite data to examine ionospheric changes and their possible connections with atmospheric and geophysical events.
We use time series, frequency analysis, and maps to show patterns in the data, and document the processing so others can check the results.
02 Generative AI for Research
F-Factory Research incorporates generative AI into its research. We bring that approach to training and adoption support for researchers and research teams.
Analysis Notes
No individual analysis notes are currently published.
Explore the related research areas, analysis methods, and guidance on reading research below.
Analyses of earthquakes, volcanic eruptions, and space weather are academic research records. They are not forecasts or warnings.
Learn what we study through satellite observations, geomagnetic pulsations, and ionospheric data.
Explore Research AreasFollow the data sources, processing steps, and guides to reading figures.
View Data and MethodsThe publication policy explains the distinction between observations and interpretations, and the limits of research results.
View the Publication PolicyArticles & Glossary
Explore terms such as TEC and geomagnetic pulsations, diagrams of observation methods, and guides to reading the data. These pages offer a starting point for understanding the research.
We explain observations separately from their interpretation. When a cause is uncertain, we describe possible explanations and what would be needed to test them.

05 Data & Methods
Which data were used, how were they processed, and what do the figures show? These pages explain the steps and caveats needed to check an analysis.
We check the provider, product name, version, target period, and terms of use.
We check gaps and quality flags, and align time, coordinates, and observation paths.
We state the processing conditions and read the results alongside the original values and comparison data.
We explain the results with their sources, limitations, and conditions for reuse.
06 News & Updates
Updates on published papers and research-related news.
07 Contact
From observation data to an academic website, tell us what you are working on and where you need support.
We discuss your data and the methods you want to examine, then agree on an approach and what can be shared publicly.
Review Collaboration TopicsUse our official contact channel to discuss research support, ask about the site, or report a correction.
Contact Us