Scope of the Research
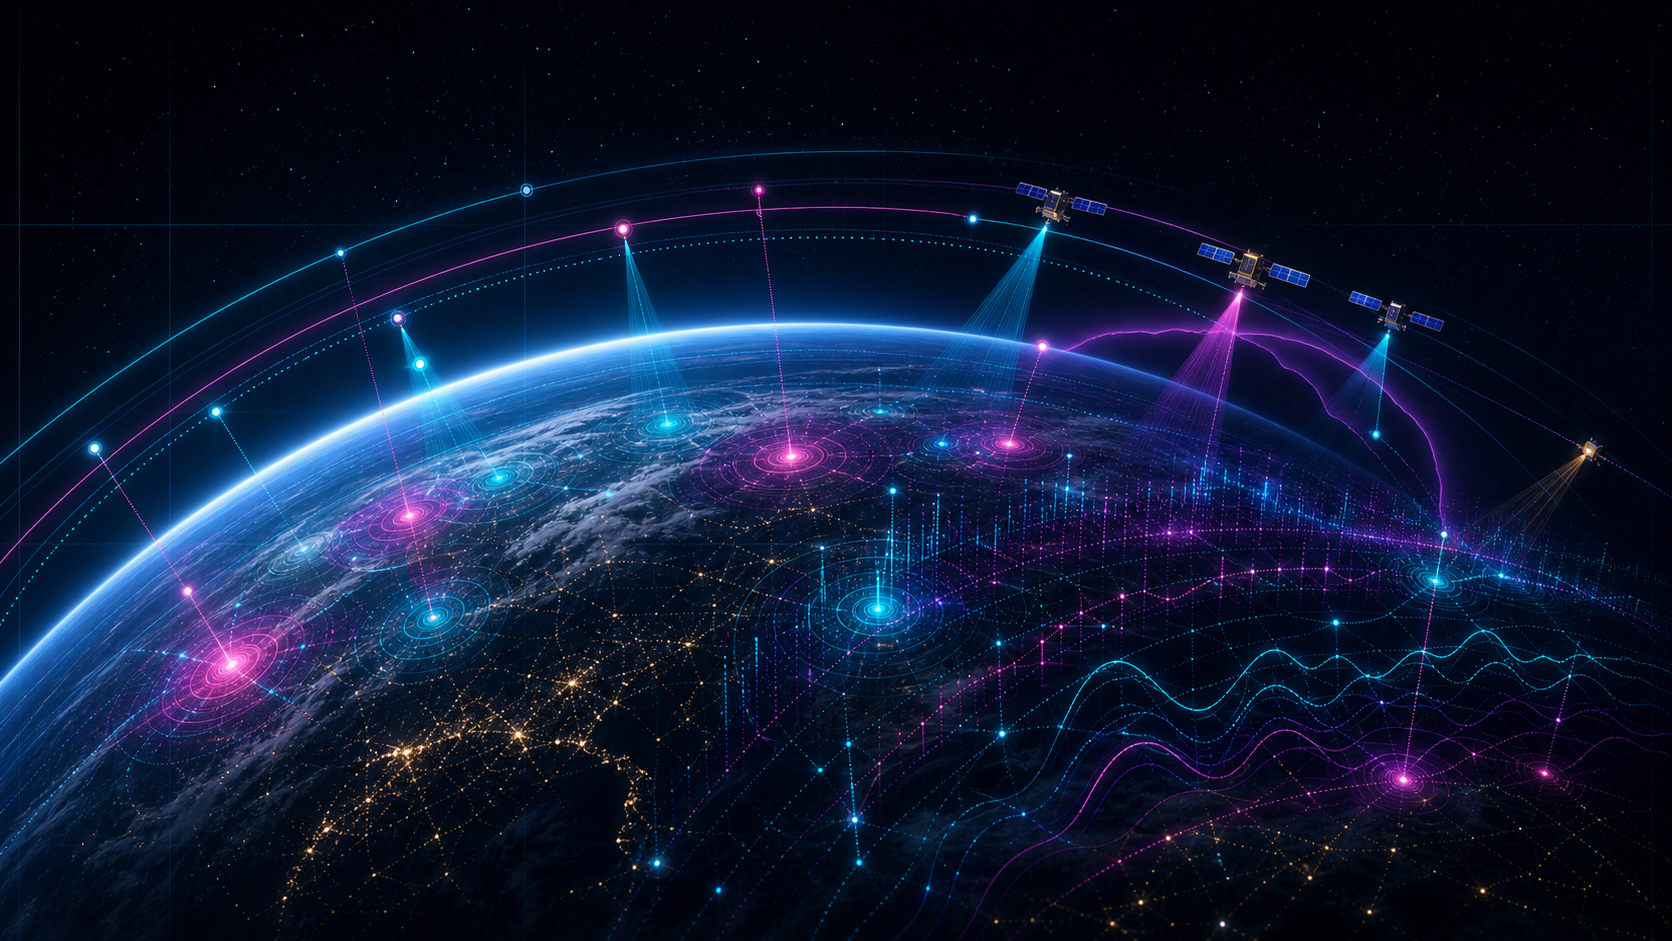
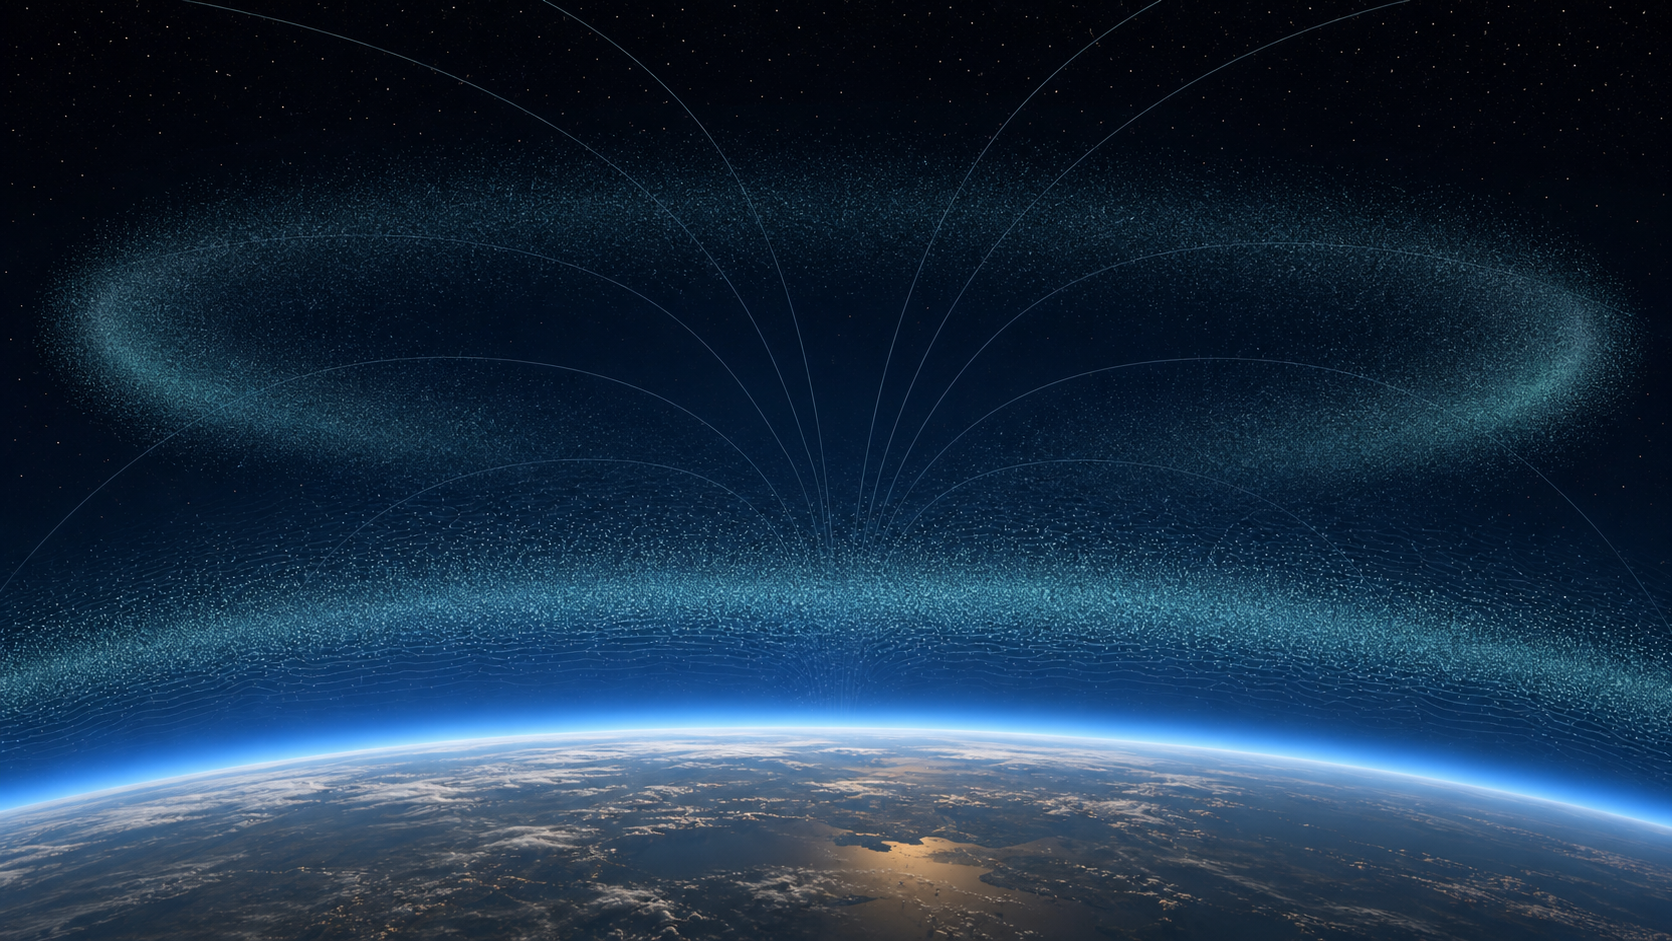
Our main research interests are variations in the ionosphere and the overlying plasmasphere. These regions also matter for radio propagation and satellite navigation; this page introduces the approach to comparing and interpreting observations.
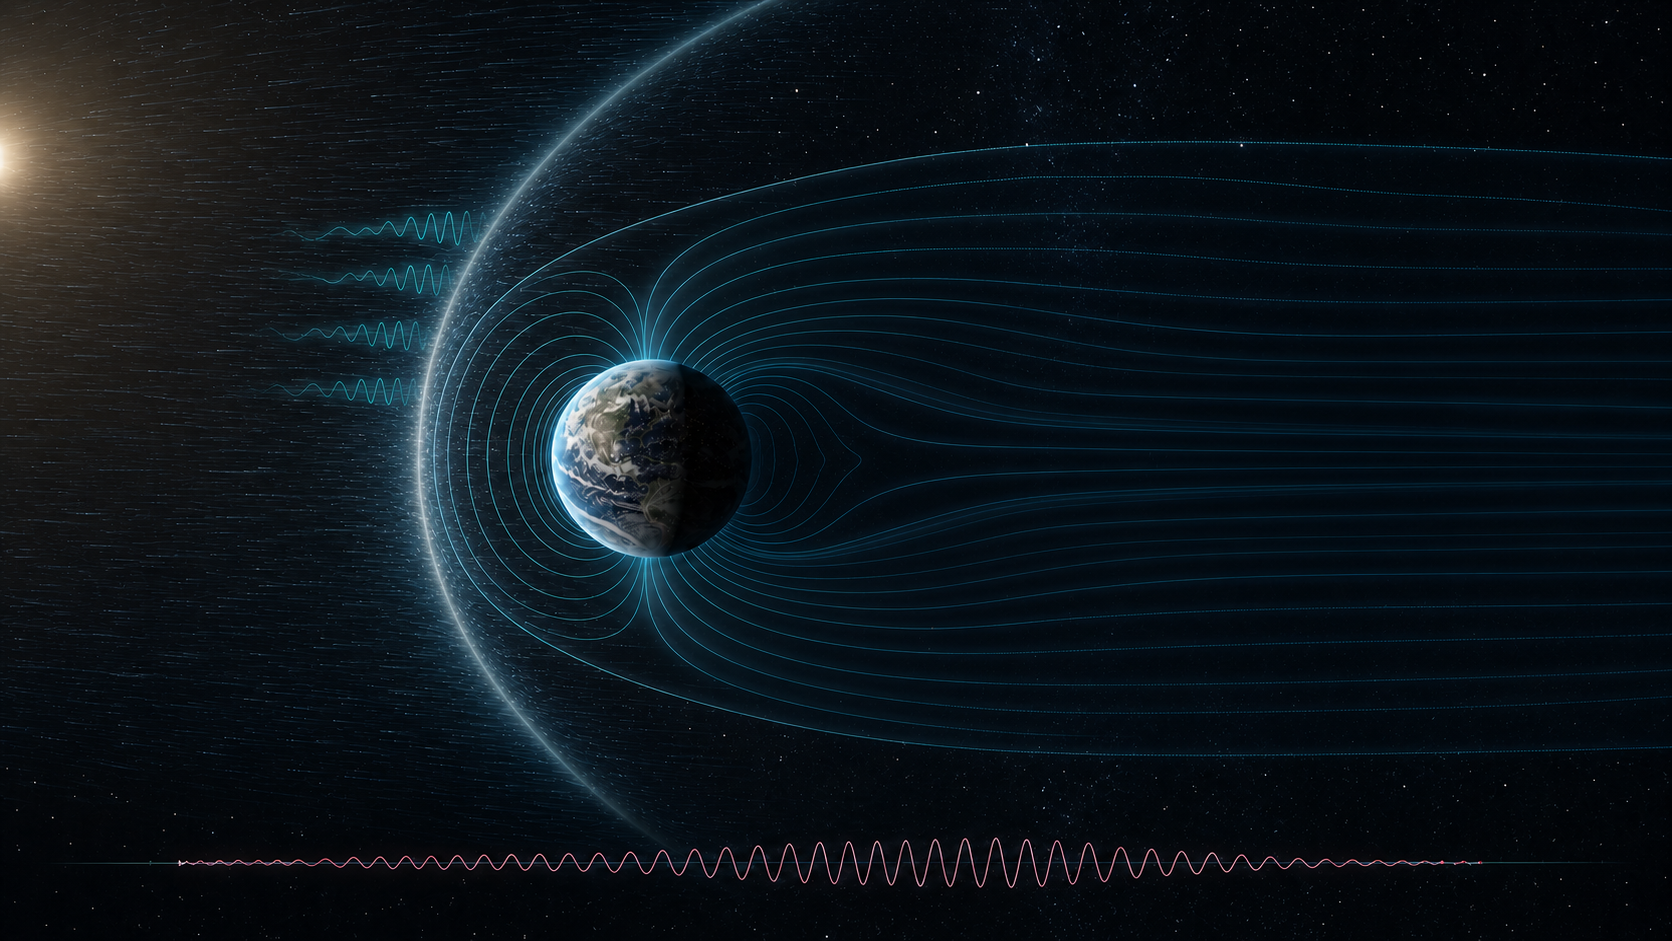
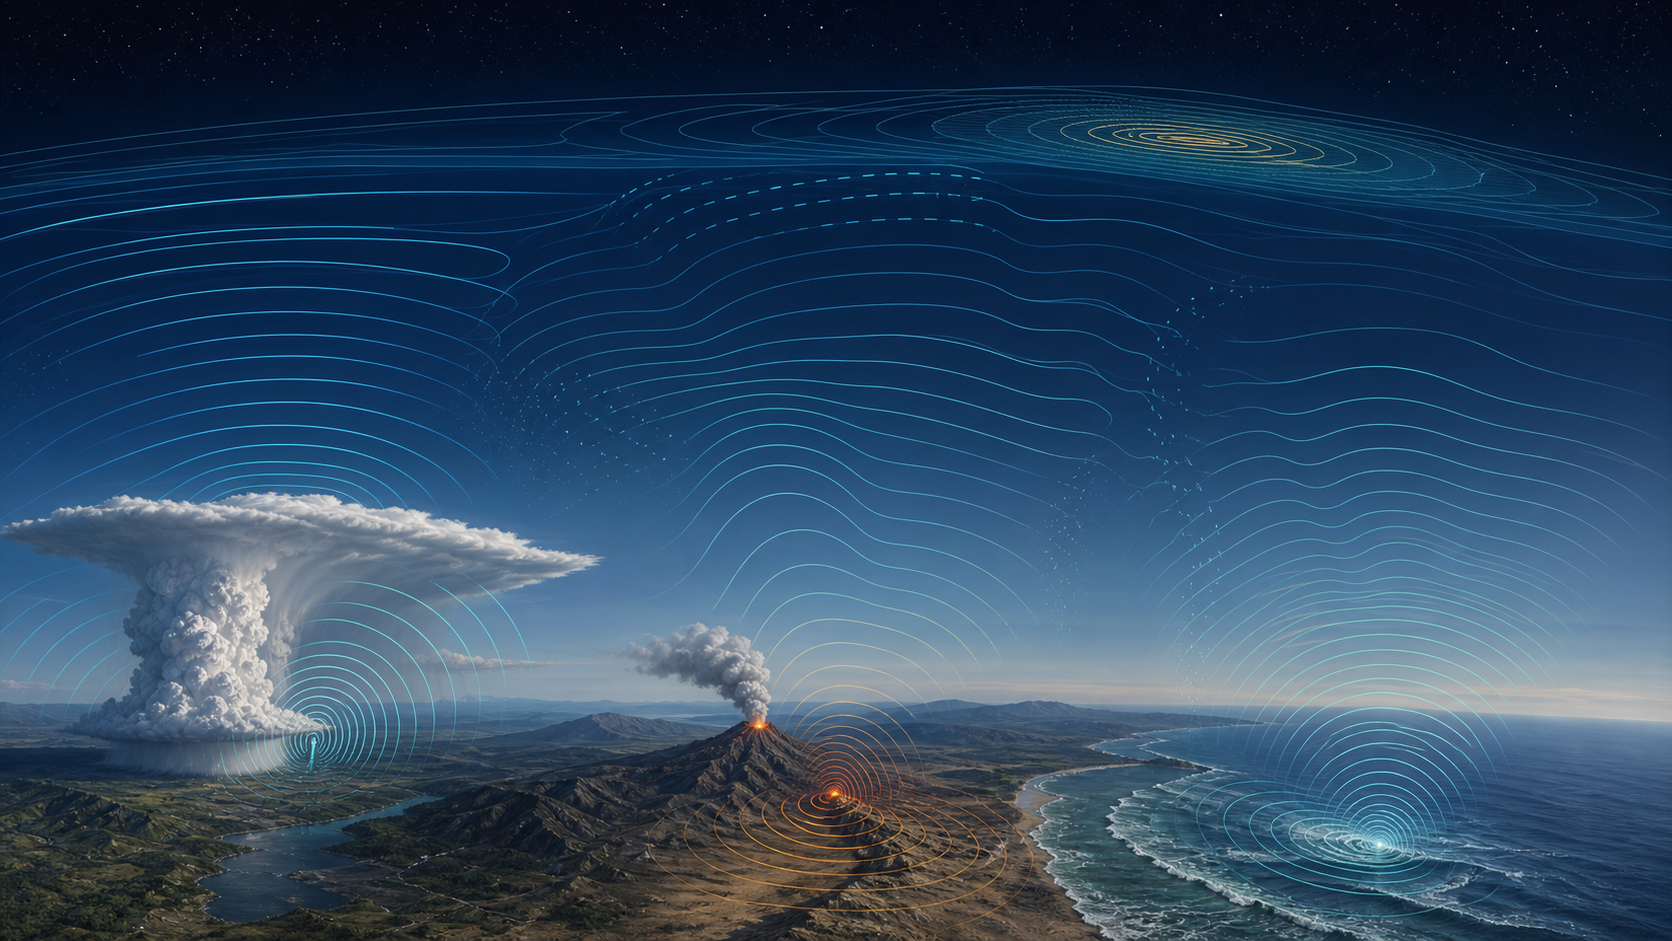
Energy and momentum transport from the neutral atmosphere, and coupling with the magnetosphere, are also of interest. Satellite and ground observations help examine several possible contributing factors.
The lower atmosphere is not the main analysis target, but weather and other background information can help examine its relationship with the upper atmosphere. The altitude diagram is a conceptual overview of the regions.
(km)10,0001,0001000
60 km+ Neutral
atmosphere
Main Observations
Satellite and ground observations differ in location and measured quantities. The table outlines typical uses in a comparison; it does not mean that every product directly measures every listed quantity. An analysis needs to identify the product, version, and observation coverage used.
Table symbols: ● identifies a typical analysis target; − means the target is not listed for that data type in this table. The symbols do not indicate whether a quantity is directly measured.
| Data type | Purpose and use | Main evaluation and analysis targets | ||||
|---|---|---|---|---|---|---|
| Ionospheric electron density | Ionospheric disturbance (plasma structure) | Electric fields and currents (dynamo) | Atmospheric density (thermosphere) | Solar and magnetic disturbance response | ||
| GNSS-TEC | Maps total electron content at high cadence to detect disturbances and analyze structure. | Typical analysis target | Typical analysis target | Typical analysis target | Not listed as a target in this table | Typical analysis target |
| Low-Earth-orbit satellites | Directly observe thermospheric density, composition, ion speed, and related coupling along satellite tracks. | Typical analysis target | Typical analysis target | Typical analysis target | Typical analysis target | Typical analysis target |
| Geomagnetic indices | Describe the intensity and timing of magnetic storms and substorms, providing context for examining the ionosphere-thermosphere response. | Typical analysis target | Typical analysis target | Typical analysis target | Not listed as a target in this table | Typical analysis target |
| Background context | Summarizes solar, geomagnetic, and meteorological conditions to separate and interpret disturbance drivers. | Not listed as a target in this table | Not listed as a target in this table | Not listed as a target in this table | Typical analysis target | Typical analysis target |
Analysis Workflow
Coverage, timing, and geometry are checked in sequence to select observations that can be compared. Alternative conditions help test whether a feature persists beyond a single view of the data.
- Coverage
Define the target time, region, satellite-receiver pairs, and baseline interval, then check coverage and missing data.
- Timeline
Place TEC, satellite observations, and geomagnetic indices on a common time axis to examine their relationship with background variability and external disturbances.
- Geometry
Check latitude, longitude, local time, geomagnetic latitude, and elevation, accounting for differences in observation location.
- Careful interpretation
Avoid conclusions from a brief change; check whether the feature also appears in other intervals or observation paths.
Figures and Interpretation
The figures here are schematic examples of display formats. Time series and maps show different aspects of an observation. Read them alongside observation geometry, processing conditions, and uncertainty rather than relying on the pattern alone.
Time Series
Track temporal changes and identify the timing of events and variability.
Spatial Views
Visualize latitude-longitude distributions to describe structures and spatial extent.
Observation Geometry
Show observation geometry so IPP positions and line-of-sight directions can be interpreted correctly.
Limits of Interpretation
State uncertainty and assumptions clearly so the limits of interpretation remain visible.
Connections to Other Research Areas
Low-Earth-orbit magnetic and plasma observations, and ground geomagnetic pulsations, provide related information when examining ionospheric and upper-atmospheric variation.
Comparisons with lower-atmosphere and geosphere events also require background conditions, including solar and geomagnetic activity.
Each research-area page explains its observations and approach to analysis. Agreement between several datasets does not by itself establish causation.
Research Information and Inquiries
The following pages provide publication information, processing guidance, and a contact route.